Data Visualization TBR News Media
2018Overview
Infographics designed to emphasize specific trends in data; published alongside editorial content. All charts/graphs were published and distributed by TBR News Media during 2018.
Technology used
Violent Crime, Drug Statistics - Town of Brookhaven - Simple bar charts were used to communicate the most relevant trends from the dataset (provided by the Suffolk County Police Department).

Housing Budget Breakdown - Town of Huntington - A box-and-whisker chart was used to visualize differences in funding allocations by category.
Student Enrollment - Suffolk County - A bar chart was used to display changes in student enrollment rates in different cities throughout Suffolk County.

Preservation of Historical Sites - Town of Brookhaven - The timeline was designed to be readable at a glance with months listed clearly along the X axis and color coded markers for each event.

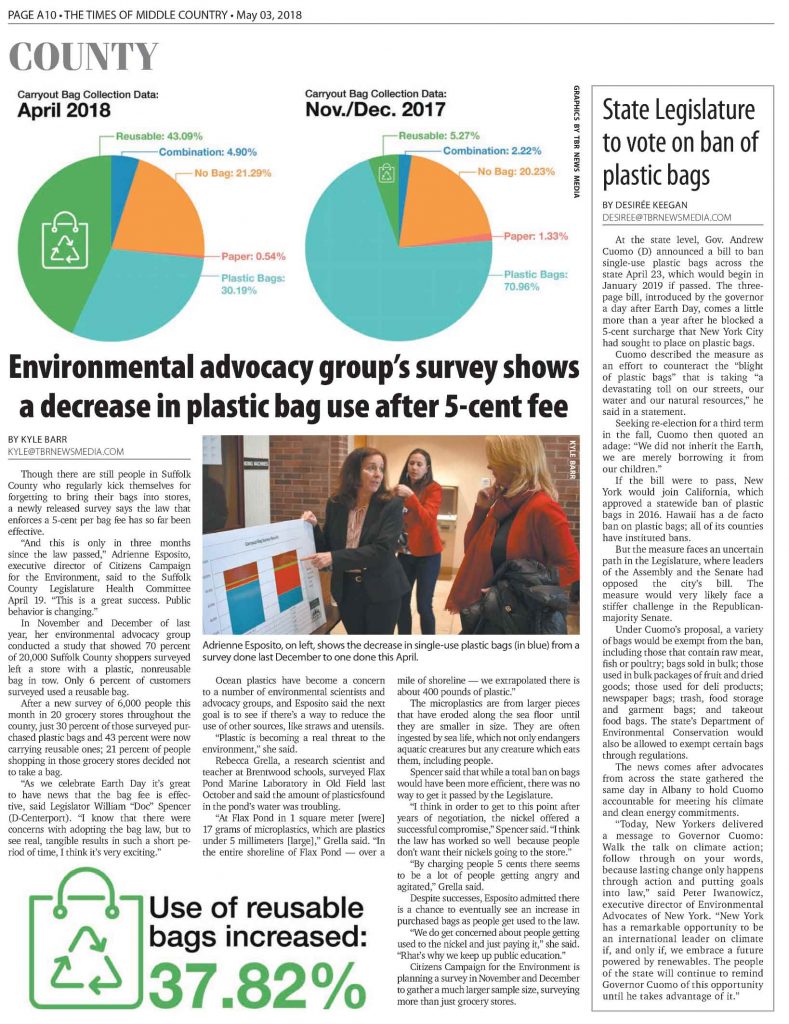
Disposable Grocery Bag Usage - Suffolk County – 2017 vs 2018 - Two color coded pie charts represent the contrasting datasets from 2017 and 2018. A simple graphic was used to create visual emphasis on the main data point (+37.82% usage of recyclable bags).